

Service explorer
Monitor service health and performance with the Service Explorer dashboard
Service explorer in Tiger Console provides a rich administrative dashboard for understanding the state of your database instance. The explorer gives you insight into the performance of your database, giving you greater confidence and control over your data.
The explorer works like an operations center as you develop and run your applications with Tiger Cloud. It gives you quick access to the key properties of your database, like table sizes, schema definitions, and foreign key references, as well as information specific to Tiger Cloud, like information on your hypertables and continuous aggregates.
To see the explorer, select your service in Console and click Explorer.
General information
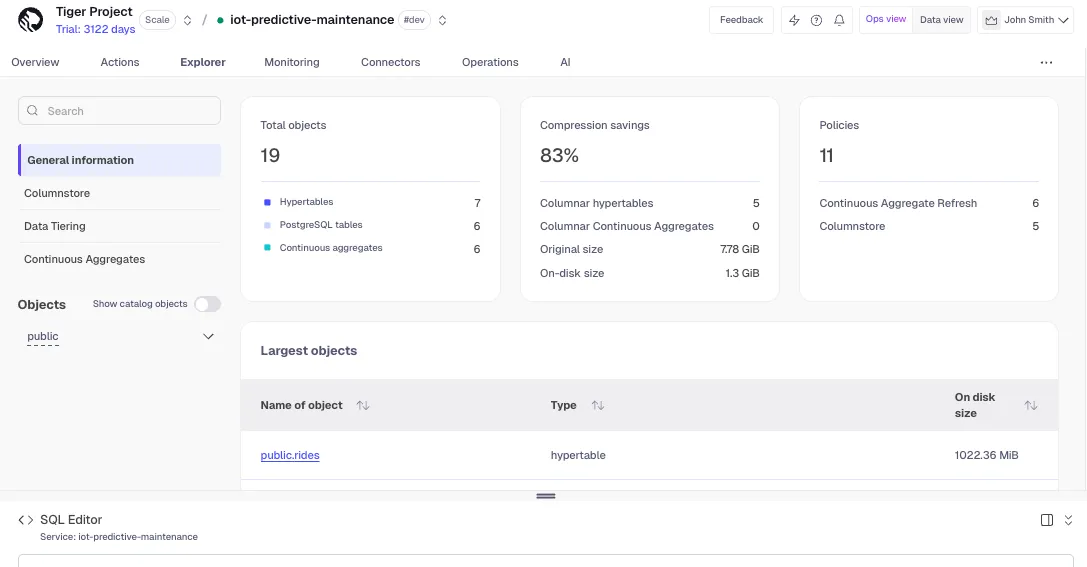
In the General information section, you can see a high-level
summary of your service, including all your hypertables and
relational tables. It summarizes your overall compression ratios, and other
policy and continuous aggregate data. And, if you aren't already using key features like continuous aggregates, columnstore compression, or other automation policies and actions, it provides pointers to tutorials and documentation to help you get started.
Tables
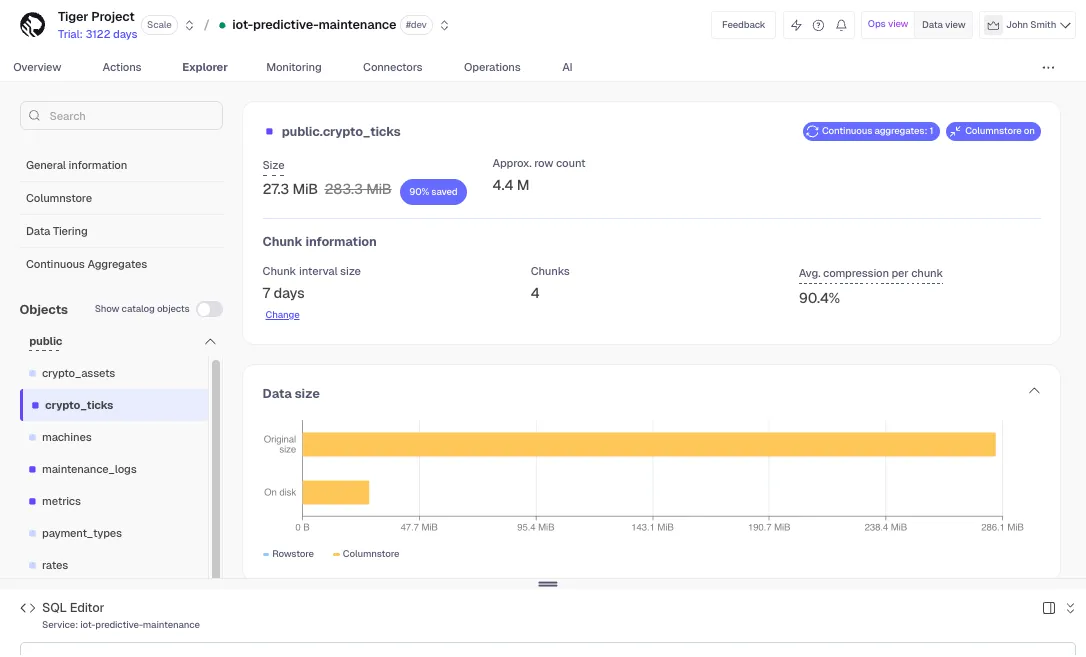
You can have a detailed look into all your tables, including information about table schemas, table indexes, and foreign keys. For your hypertables, it shows details about chunks, continuous aggregates, and policies such as data retention policies and data reordering. You can also inspect individual hypertables, including their sizes, dimension ranges, and columnstore compression status.
From this section, you can also set an automated policy to compress chunks into the columnstore. For more information, see the hypercore documentation.
When you inspect a hypertable, a timeline chart visualizes its chunks, showing their relative sizes and whether each is in the rowstore or the columnstore. By default, the chart shows the latest 100 chunks; click and drag to zoom in on a specific time range. The chart also shows the status of the latest runs for the hypertable's columnstore job, with a link to the job's deep dive page.
For more information about hypertables, see the hypertables section.
Continuous aggregates
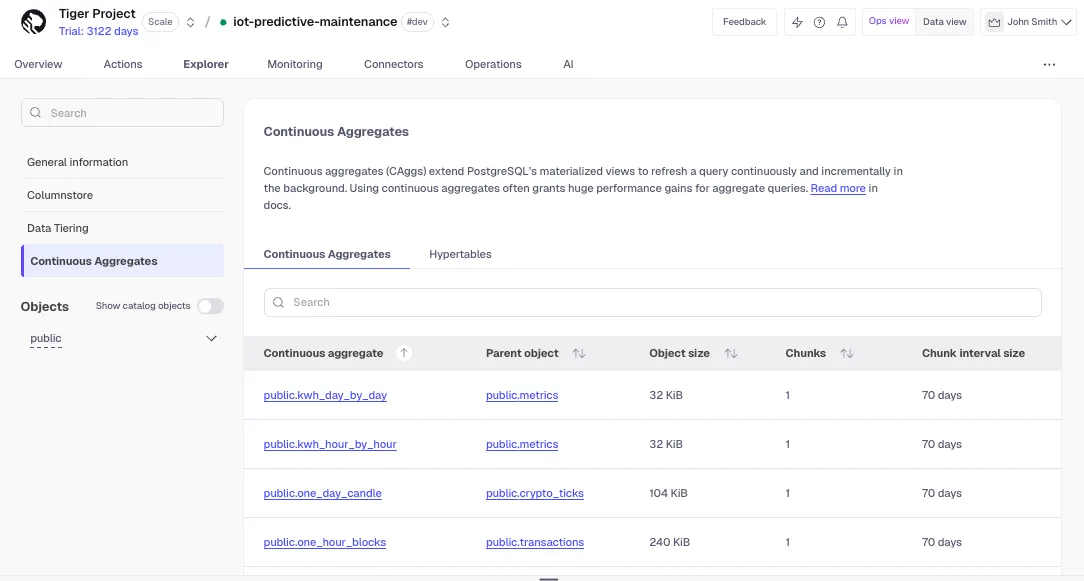
In the Continuous aggregate section, you can see all your continuous
aggregates, including top-level information such as their size, whether they are
configured for real-time aggregation, and their refresh periods.
For more information about continuous aggregates, see the continuous aggregates section.